
espite the introduction of financial incentives for developing production of photovoltaic (solar) power systems since 2000, France ranks only 15th out of 28 in Europe for photovoltaic production per inhabitant.
As a comparison, Germany sets an example with production per inhabitant five times higher. Concerns about the selectiveness of the subsidies, and the increasing burden on finances, led to a reduction in the incentives after 2010.
While Germany and other countries developed solar cadastres (public registers of property) to assess the potential of candidate roofs for solar panel installations, such initiatives are still limited to a few cities in France, Brest and Paris being the most successful examples. These cadastres often use a three-dimensional model of a city, requiring expensive data collection and treatments, and, consequently, are used mostly for highly populated areas.
An open solar cadastre, assessing the potential of roofs for solar panels covering the whole territory, would not only benefit public authorities but also a whole community comprising energy providers, panel installers, consulting companies and homeowners.
The Etalab team used an innovative, cost-efficient approach combining open data and open algorithms, relying on external contributions to build a nationwide solar cadastre.
The French land cadastre provides the contours of every structure. The shape of the roof is still uncertain and visual analysis is required to distinguish a ridge going west to east (suitable for solar installations) from one going north to south. So, satellite and aerial images covering the whole French territory with sufficient precision for most situations are used.
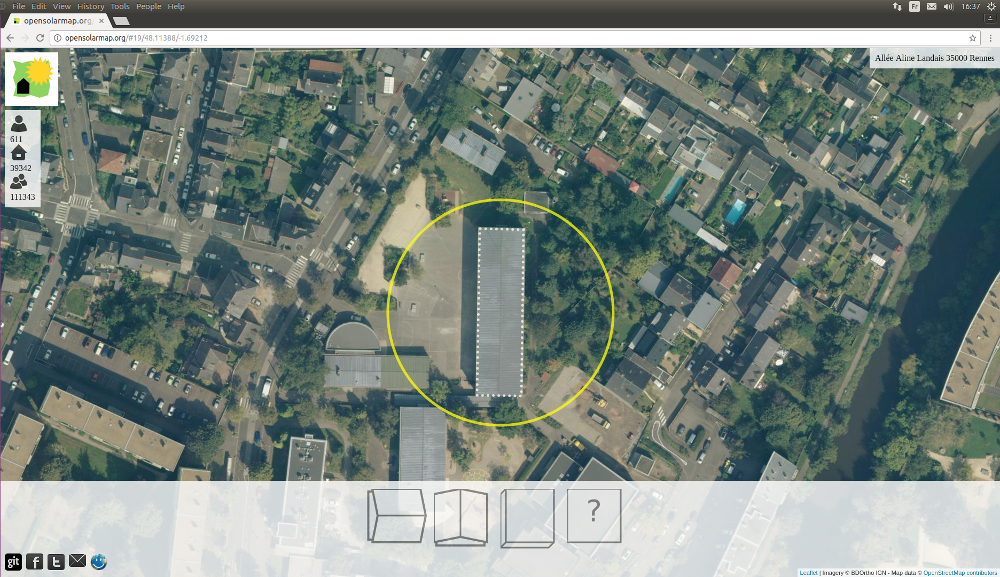
Etalab took advantage of a hackathon to design and set up a crowdsourcing platform with the help of enthusiastic developers. The platform displays the image of a roof and the user is invited to provide its orientation. The platform, being fun and somewhat addictive, received 100,000 contributions in a three-week span by word of mouth. This allowed us to classify 10,000 roofs with confidence. We identified just one case of vandalism, which was easily spotted and discarded.

This is a small sample compared to the 50 million buildings in France, but it is enough to programme an automated classifier. Using standard techniques in image processing, namely logistic regression and deep neural networks, we obtained a classifier that was correct 80% of the time. Later, we found the automated results to be comparable toéhuman contributions in accuracy. Run on standard hardware, the classifier takes one second to make a decision on an image.
This classification challenge was later taken on by a hundred teams during the Data Science Game, an international data science competition. The winning team, using newer neural networks and advanced techniques like data augmentation, fine tuning and ensemble learning, achieved a 30% lower error rate.
Solution and action
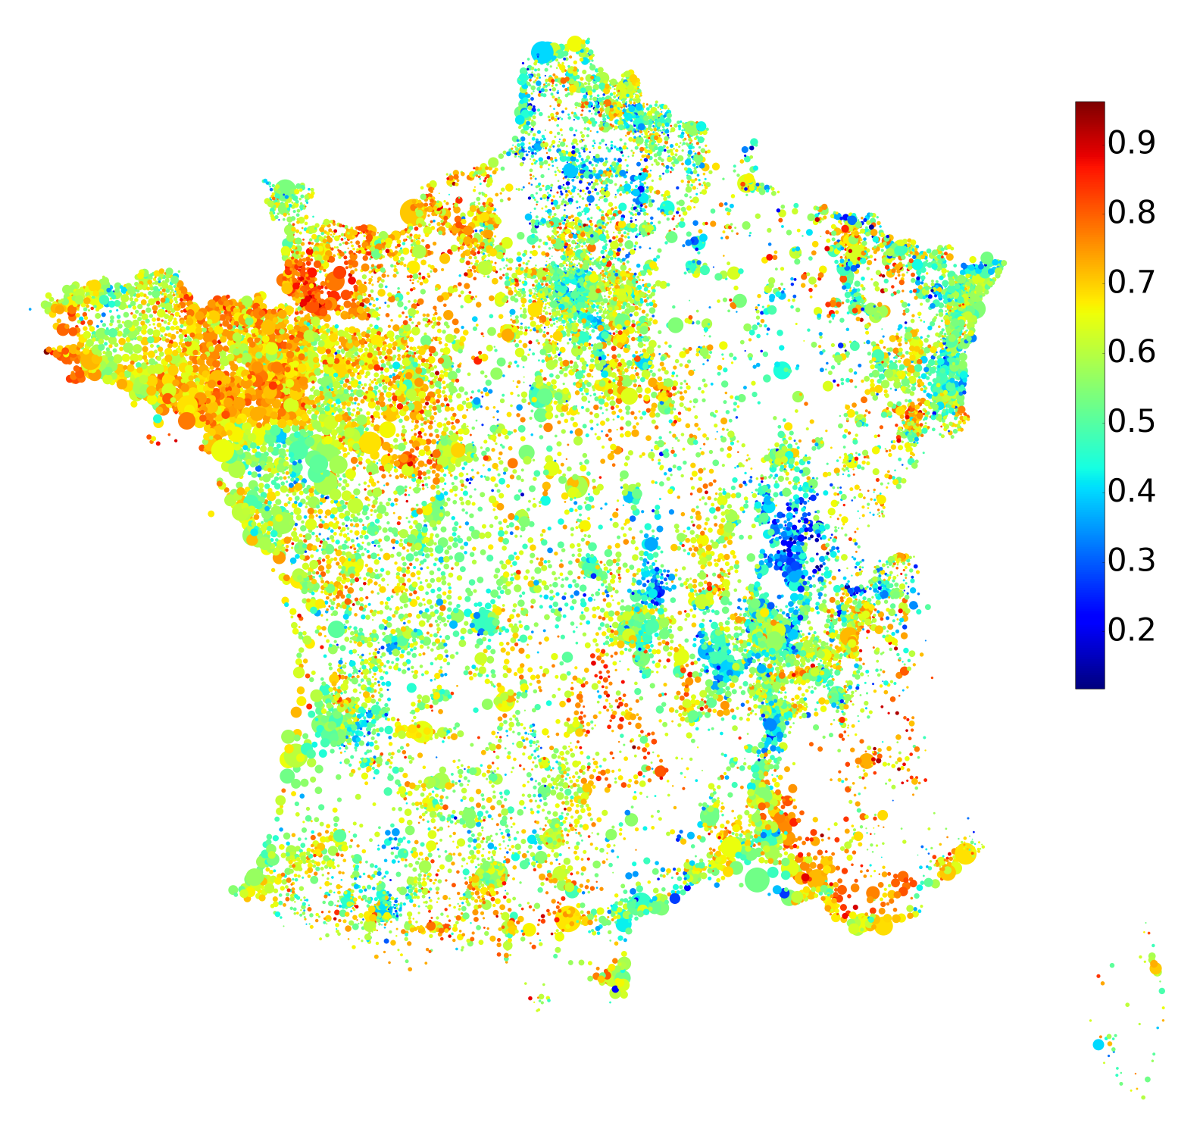
The nationwide map of roof orientation shows differences between regions affected unequally by wind and topography. For example, most roofs in Brittany have a favourable orientation, whereas the opposite is the case in the éRhène Valley. This map is of great importance to assess the relevance of solar incentives at a local level. It is worth comparing with the solar exposure to evaluate solar potential.
The solar cadastre doesn’t take into account shades or the angle of inclination of roofs, and it discards roofs with complex shapes. However, it is intended to be completed by more precise, possibly local and expensive, data to deliver a better result. All the data, as well as the codeéused and produced in this project, is open and documented. Therefore, it is easy for éanyone working in this field, whether from the public or private sector, to quickly build an improved solar cadastre on top of ours or to replicate it in another country.
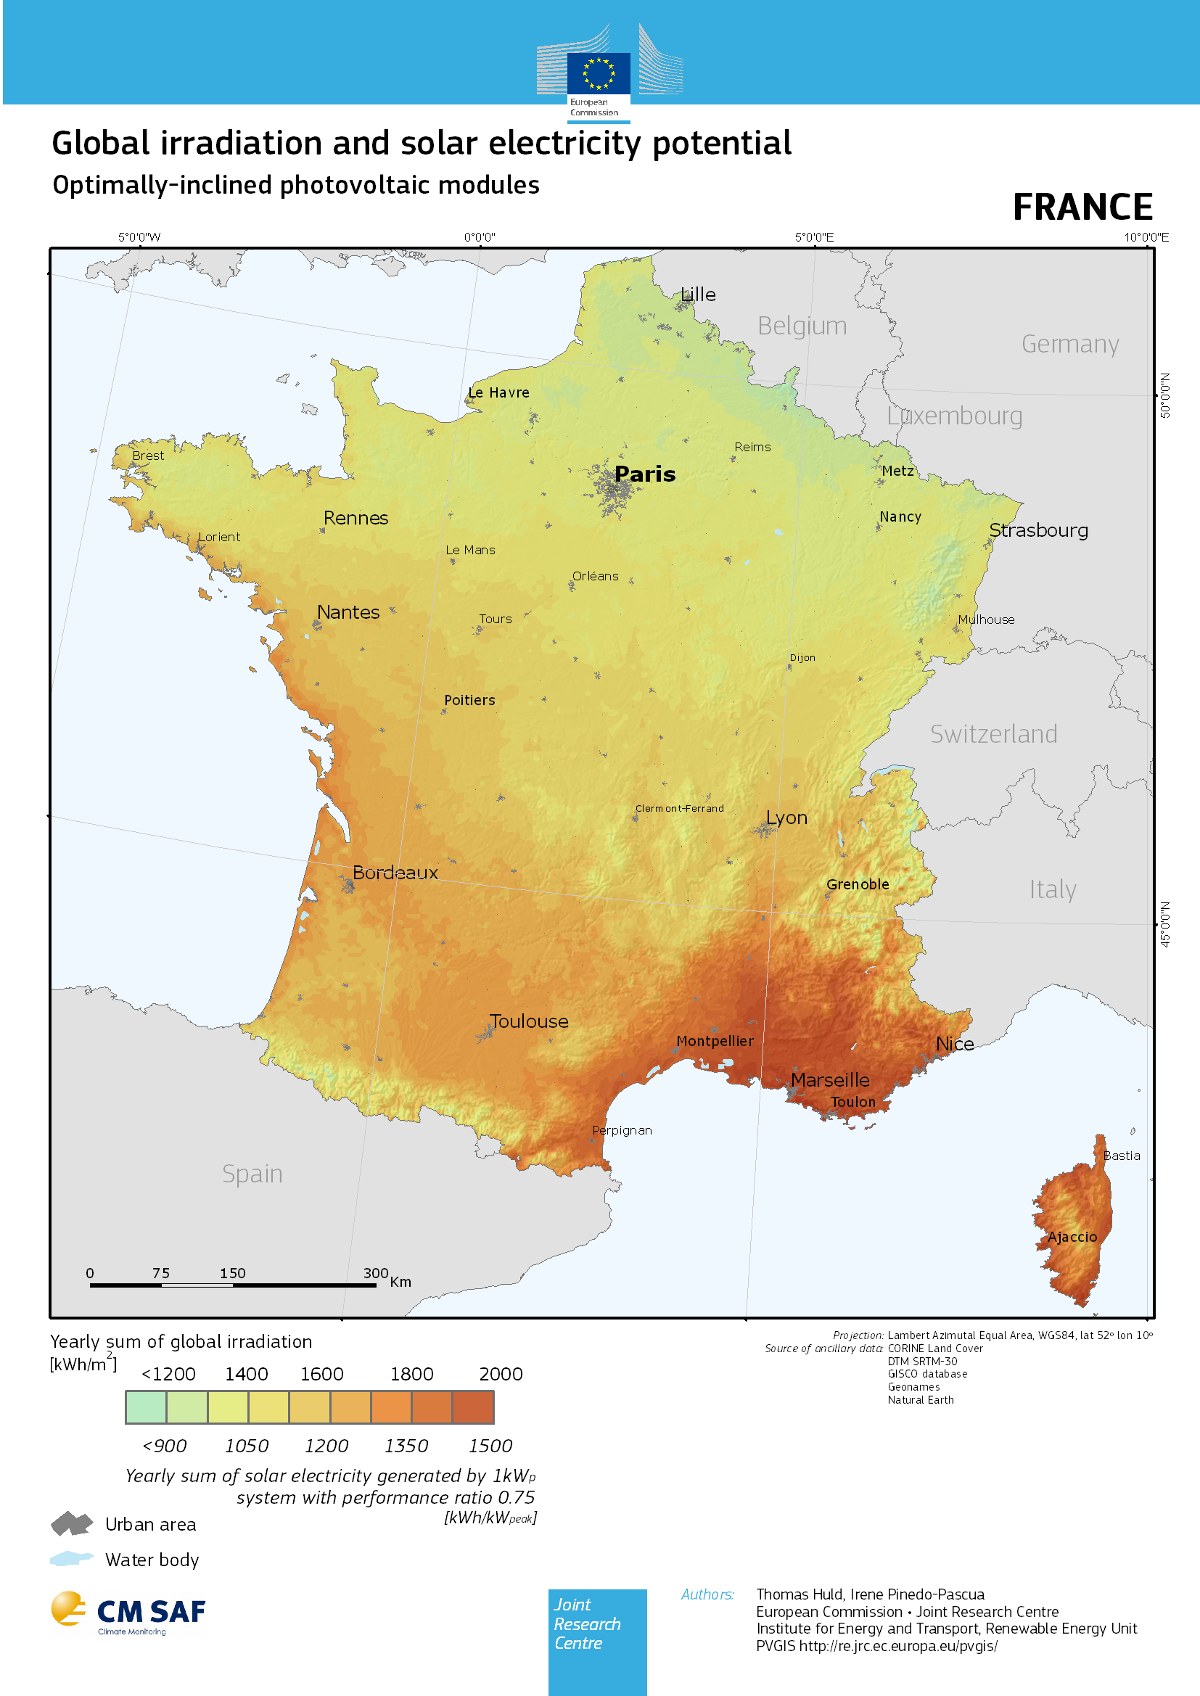
Horizontal irradiation – France. Source: PVGIS é European Union, 2001-2012 (Copyright: 2011 GeoModel Solar s.r.o.)
Learnings
As a government service attached to the Prime Minister, Etalab prefers inclusive approaches to closed ones. Machine learning projects like this one seem particularly suited to public participation. Every citizen, regardless of their skills and expertise, can offer their help using a crowdsourcing platform.
Calling on public participation is also a natural way to communicate and advertise the goals of the project.
The Etalab team benefited from voluntary contributions during the development of the crowdsourcing platform, the construction of the training set and the building of automated classifiers. Additionally, we rooted our project in open data and open source tools. In this way, a team of two people managed to develop this project within a few months, for negligible hardware costs. Although projects using machine learning are often termed é?Big Data’, it would be a misnomer in this case, since we systematically favoured small-scale, quick and cost-effective methods, involving manageable amounts of data.
This approach lays the foundation for tools facilitating the work of public decision-makers involved in energy policies. It could be easily replicated for similar issues; for example, detection of bus lanes and pedestrian crossings, for land-use classification, and so on.
We demonstrated the application of state-of-the-art, free, open-source, well-packaged machine learning solutions outside of a research context. Engineers and developers can now extract value from images without having to be specialists in image processing or deep learning. It is probable that such tools will become increasingly widespread and eventually find their way into the general IT engineer’s toolbox.
This blogpost was originally published on the British Civil Service Quarterly.